
Study: Largest Cities Becoming Increasingly Unaffordable
Another analysis found similar results, as well as falling prices in some metro areas, mostly in the Northeast.
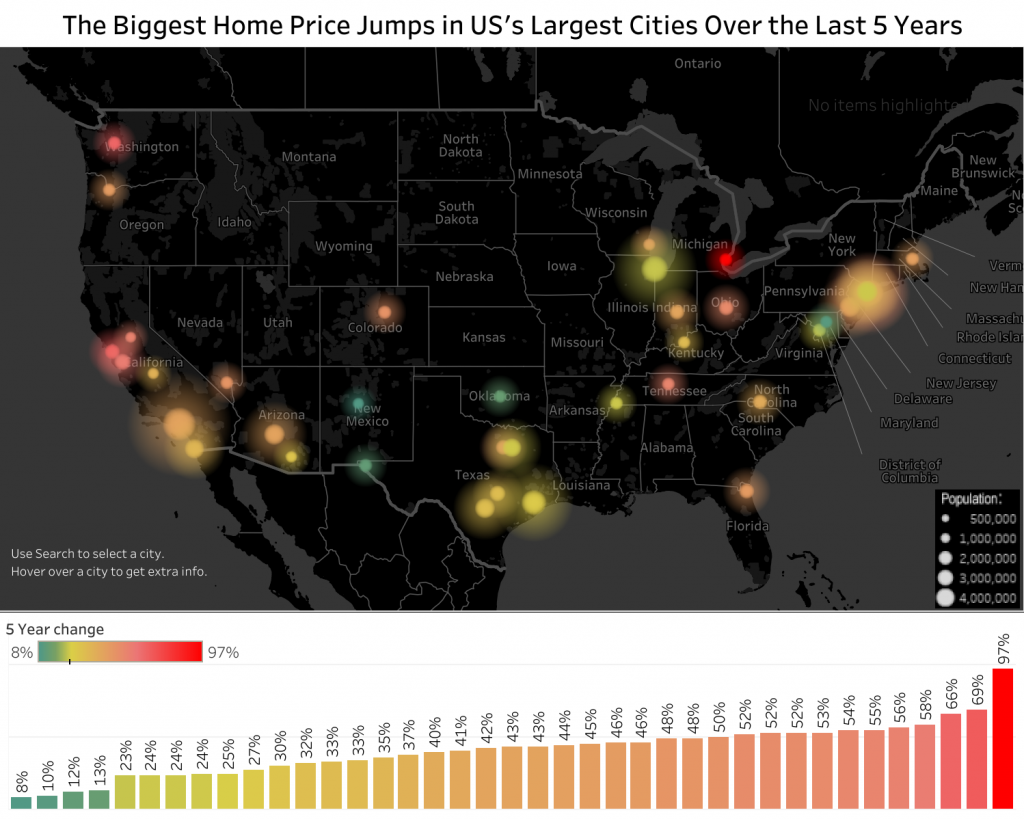
A study of home price changes between 2013 and 2018 in North American cities showed a surge in prices, with the 11 largest U.S. cities seeing more than a 50% jump. The research from Point2 Homes is just one more sign that housing affordability is becoming a larger hurdle for more Americans.
Here are some key findings:
- Top Percentage Increases: Of the top cities with the most staggering increases, four are in the United States. Detroit reported a stunning 97% growth. San Francisco comes in third, while Seattle and San Jose rank eighth and tenth.
- Detroit 97% growth translates to a mere $30,000 net increase. Compared to San Francisco, that’s a trifle. The Golden Gate City boasts a $550,000 upsurge in just five years, an amount that could easily get you another house in many cities across the country. San Jose is not far behind with a net growth of $355,000 whereas homebuyers in Seattle must dish out an additional $278,000 to become homeowners compared to five years ago;
- Price Drops: None of the top largest U.S. cities experienced any price drop in the last five years.
Incomes in North America have risen slowly and steadily since 2013, but have been no match for home price growth.
As a result, housing affordability is becoming increasingly problematic in many cities across North America. While the traditional rule of thumb – that a homebuyer should afford a home if its value is three times or less the annual household income – still holds in some markets, others are far more expensive than that.
https://infogram.com/the-biggest-home-price-changes-in-north-americas-largest-cities-1h7z2l5w0olg6ow
Five-Year Home Price Upsurge in North America’s Largest Cities
To look at one of the most extreme cases, Canadian prospective homebuyers could have bought a home in Surrey, B.C., for around $450,000 (Canadian dollars) in 2013, but they currently need almost double that: $845,500. Vancouver, B.C., follows suit, with a 68% increase in the past five years, and Brampton, Hamilton, and Mississauga, all three cities located in Ontario, are almost at a tie, with increases hovering around 66%.
In the U.S., Detroit stands out, with home prices that have doubled since 2013. For a city in recovery, severely affected by economic setbacks and demographic decline, increasing home prices might just be a sign of a local economy on the mend.
San Francisco saw the second highest jump, with a home price increase close to 69%. The other talent and tech hub on the West Coast, Seattle, boasts the third most significant price gain (66%).
A 10-Year Comparison
Online lending marketplace LendingTree® released its analysis of how the housing market has changed since 2009.
The study looks at the 50 largest metropolitan areas in the U.S. to see where housing prices have recovered the most since the height of the Great Recession — and where values are still struggling. The study also looks at how income and unemployment rates have changed since 2009.
That study found that housing prices have rebounded from their lows during the Great Recession and are now starting to cool. In many cases, home values have even exceeded their 2006 highs.
LendingTree found that on average, median home values have increased by nearly $50,000 across the 50 largest metros in the United States since 2009. Increasing incomes and falling unemployment rates have likely fueled this increase, the researchers said.
Prices have fallen in four metros since 2009: Hartford, Conn., Chicago, Virginia Beach, Va., and Baltimore. On average, these areas have seen home prices fall nearly $6,700. According to LendingTree, “It is difficult to blame these results on a single factor, but, in many of these areas, a lack of strong employment opportunities and out-of-state migration might play a role.”